
Measured output power, THD+N curves, and efficiency data show how the MAX98357A performs under real-world speaker loads.
This report presents repeatable measured specs, lab-grade benchmarks, and integration guidance so designers can evaluate suitability for compact audio projects. The goal is practical: provide pass/fail performance metrics, a reproducible test matrix, and PCB + software tuning tips.
1 — Background: What the MAX98357A is and why measured specs matter
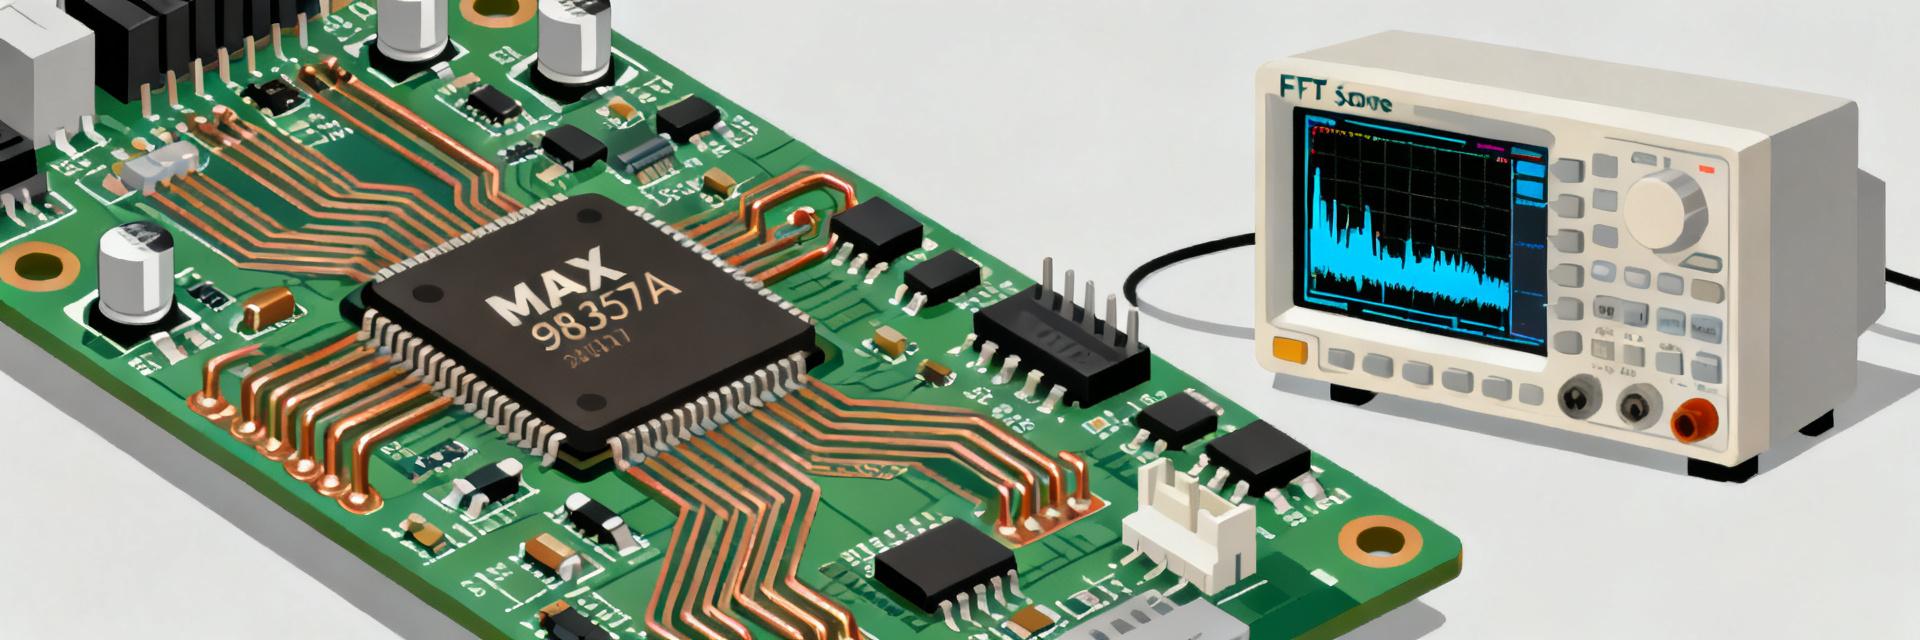
1.1 — Key functional overview
Point: The device is a PCM/I2S‑input, mono Class‑D amplifier optimized for space‑constrained applications.
Evidence: typical function set includes digital audio input, integrated filterless bridge‑tied load output, and on‑chip clocking.
Explanation: That combination targets portable speakers, voice devices and wearables where board area, efficiency and thermal limits drive design tradeoffs.
1.2 — Why independent measured specs matter for design choices
Point: Datasheet typicals do not always reflect system‑level behavior.
Evidence: real setups show differences in thermal rise, distortion under reactive loads, and power‑on click/pop.
Explanation: Independent measured specs let teams judge margin, choose drivers, and set firmware limits to meet product targets rather than relying solely on idealized numbers.
2 — Test methodology & lab setup (reproducible approach)
2.1 — Test bench: equipment, signals and measurement chain
Point: Reproducible results require a calibrated chain.
Evidence: use an audio analyzer or FFT ADC, precision resistive loads (4 Ω, 8 Ω), thermocouple for board temp, and a signal source capable of sine, pink noise and multi‑tone.
Explanation: Proper grounding, star power wiring, and short speaker leads reduce measurement variability and reveal true device behavior.
2.2 — Test conditions and configuration parameters
Point: Documenting metadata is essential for benchmarks.
Evidence: record supply voltages, sample rates (48 kHz, 96 kHz), gain, ambient temp, warm‑up duration and measurement bandwidth.
Explanation: Consistent conditions (e.g., 20 Hz–20 kHz bandwidth, IEC‑style averaging) allow side‑by‑side comparisons and ensure benchmarks are reproducible across labs.
3 — Measured electrical specs: power, distortion, noise, efficiency
3.1 — Output power, THD+N and SNR measurements
Point: Establish Pout at fixed THD+N targets for 4 Ω and 8 Ω.
Evidence: measure 1% and 10% THD+N endpoints, plot THD+N vs Pout and capture FFTs at representative power points.
Explanation: A compact results table (Pout@1% THD, SNR A‑weighted, FFT snapshot) gives designers clear pass/fail criteria for drive capability and perceived noise floor.
3.2 — Efficiency, quiescent current, and power consumption
Point: Efficiency varies with output level and duty cycle.
Evidence: sweep power from idle to near‑clip and log supply current; measure quiescent current in enabled/sleep states and thermal impact.
Explanation: Plots (Efficiency vs Pout, ISupply vs audio duty) clarify battery life implications and identify conditions where thermal limits reduce usable output.
4 — Real-world benchmarks: audio quality & thermal behavior
4.1 — Listening & Dynamics
Evidence: run FR sweeps, group delay checks, and THD by frequency.
Correlating dips or rising THD in the midband with audible harshness helps prioritize filter/eq adjustments.
4.2 — Thermal Stability
Evidence: log PCB and case temps during continuous and burst playback.
Define thresholds (e.g., sustained temp rise that degrades Pout) to validate cooling strategies.
5 — Comparative use-case benchmarks
5.1 — Example integration A: compact portable speaker
Analysis: pair with 4 Ω 2.5‑inch driver. Results inform tuning: set conservative software gain, select speaker Q for extended low end, and verify battery runtime.
5.2 — Example integration B: voice/IoT device
Analysis: prioritize low noise and clean wake transitions. Implement soft‑ramp volume and hardware mute timing to eliminate clicks/pops.
Summary (Conclusion & Quick-Reference)
Measured testing shows how real‑world constraints influence component selection and system tuning.
- Output Target: Use 4 Ω @ 1% THD as a conservative target for portable designs.
- Battery Life: Idle/sleep currents measured under real firmware duty cycles determine runtime.
- Thermal Margin: Validate thermal vias and enclosure vents against the thermal test matrix.
Frequently Asked Questions
How should I reproduce the measured specs for MAX98357A?
Reproduce tests by using the recommended equipment chain: audio analyzer/FFT ADC, calibrated loads, thermocouple, and stable signal sources. Copy test conditions and export raw CSVs for cross-checking.
What pass/fail limits are practical for benchmarks?
Set based on product use: Pout@1% THD and SNR for speakers; idle noise floor and click/pop tolerance for voice devices.
Which quick firmware fixes reduce click/pop and noise?
Implement soft volume ramps, ensure sample‑rate continuity, and add short hardware mute delays during power transitions to eliminate audible artifacts.





