
Measured standby and active currents drive battery life in modern BLE designs; a compact reference that distills the nRF52840 datasheet into actionable numbers helps engineers prioritize tests and trade-offs. This guide converts dense tables into a quick spec snapshot, highlights the power metrics that most affect battery life, and delivers a reproducible test and optimization checklist.
Readers will get a short SoC spec summary, the key power metrics and their test conditions, a worked battery-life example using conservative measured numbers, and a prioritized checklist for hardware and firmware tuning suitable for US product designs.
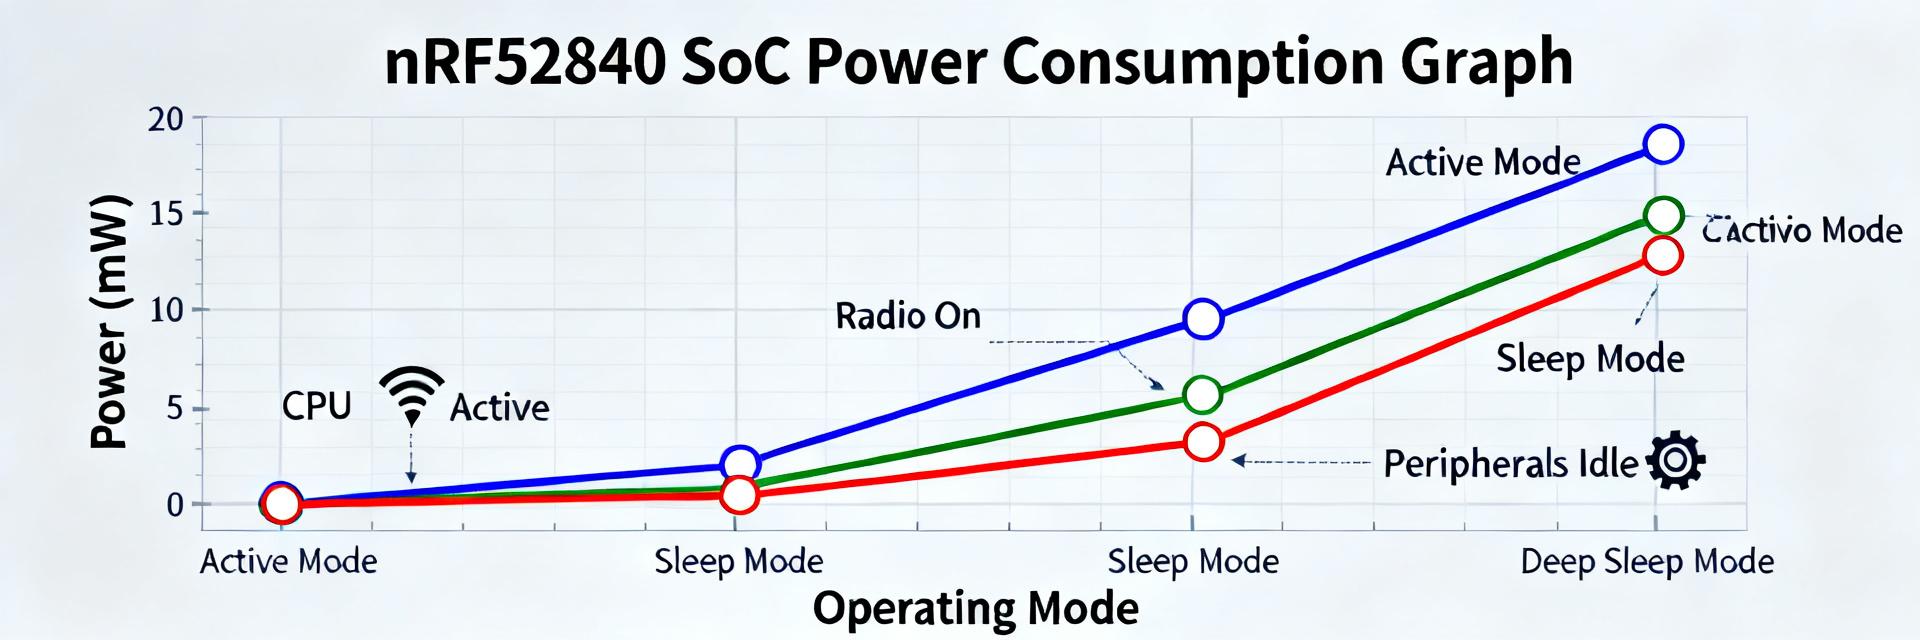
(2) Key power metrics in the nRF52840 datasheet — quick reference
Sleep, standby & system OFF figures
Point: The lowest-power modes define baseline battery drain.
Evidence: Datasheet lists deep-sleep and system‑OFF currents under specific conditions (regulators on, RAM retention, RTC running).
Explanation: Expect microamp or sub‑microamp range for system‑OFF with minimal retention; confirm RAM retention and RTC state because each enabled block raises the listed power metrics.
Active, TX/RX and peripheral currents
Point: TX power and duty cycle dominate average consumption.
Evidence: Datasheet provides TX/RX currents at various output powers and CPU active currents under full load.
Explanation: Typical active CPU, RX and TX currents are milliamps; ADC sampling or SPI bursts add transient spikes. Average current is set by event duration × current, so reduce event time or duty cycle first.
(3) Interpreting datasheet numbers vs. real-world measurements
Test conditions and common gotchas
Point: Lab conditions in the datasheet are controlled and often optimistic. Evidence: Test vectors assume matched antenna, ideal supply, specific temperature, and minimal board leakage. Explanation: Measured values may be higher due to board leakage, regulator quiescent current, antenna mismatch, or peripherals left enabled — document each condition when comparing numbers.
How to reproduce datasheet numbers in your lab
Point: Reproducibility requires isolation and repeatable firmware. Evidence: Use a minimal breakout with a matched antenna, stable supply, and test firmware that loops the tested state only. Explanation: Recommended measurement technique: high-sensitivity ammeter or low‑value shunt + differential ADC, short test windows averaged over many cycles, and disabling non-tested peripherals to mirror datasheet conditions.
(4) Design checklist: measuring and optimizing power for battery designs
Hardware knobs
Regulator, decoupling, antenna, and IO
Point: Hardware choices set the floor for idle power. Evidence: Regulator quiescent current, PCB leakage, and antenna efficiency directly affect measured power metrics. Explanation: Pick low‑Iq regulators, minimize GPIO leakage with known pull states, tune the antenna for required link budget, and reduce external sleep-mode drain paths before attributing excess to the SoC.
Firmware knobs
Sleep strategy, peripheral batching, and radio scheduling
Point: Firmware patterns can cut average current dramatically. Evidence: Batching sensor reads and sending fewer, larger uplinks reduces wakeups; hardware timers and PPI avoid CPU wake. Explanation: Use deep sleep aggressively, move periodic work to hardware timers, batch ADC/SPI transfers, and schedule radio bursts to amortize TX ramp and handshake overhead.
(5) Worked example: power budget & battery-life estimate
Step-by-step power-budget worksheet
Point: Break average current into event contributions plus sleep baseline.
Evidence (Example):
- • TX: 8 mA @ 3 ms
- • CPU/Sensor: 3 mA @ 20 ms
- • Sleep: 2 µA
- • Interval: 300 s
Explanation: Average current = (8·0.003 + 3·0.02 + 0.002·(300−0.023))/300 ≈ 2.3 µA. On a 220 mAh coin cell, that projects multi‑year life; use this method to compute realistic expectations for your duty cycle.
Sensitivity analysis & trade-offs
Point: Small changes in TX duration or reporting interval can swing battery life significantly. Evidence: Doubling report frequency multiplies active energy proportionally; increasing TX power raises per-event energy. Explanation: Tune reporting interval first, then TX power, then sensor/sample time. Prioritize reducing wake count and event length for biggest gains.
(6) Quick decision guide & implementation checklist
When this SoC fits your product
Point: Choose the SoC when you need moderate throughput, multiprotocol support, and many peripherals. Evidence: On‑chip memory and accelerators support TLS stacks and edge processing; radio supports concurrent roles. Explanation: It's a strong fit for multi‑sensor battery devices requiring occasional uplink, local crypto, and hardware peripherals to minimize CPU wakeups.
Rapid checklist before prototype sign-off
Point: Validate power and radio on the final board early. Evidence: Measure real board currents in all modes, test radio range with final antenna, and verify regulator behavior under expected loads. Explanation: Confirm power modes, document firmware state machine for sleep/wake, and add regression tests to catch power regressions during firmware updates.
Summary
- Extract the core SoC specs (CPU clock, Flash, RAM, accelerators) and the key radio/peripheral list from the nRF52840 datasheet to form a concise hardware capability checklist for your product.
- Prioritize measuring the power metrics that most affect average current: sleep baseline, TX/RX currents at your output power, and active CPU/peripheral draws; reproduce datasheet test conditions before trusting numbers.
- Validate on the final board: use low‑Iq regulators, tune antenna, batch work in firmware, and measure event durations precisely — these three steps yield the largest battery-life improvements.
Frequently Asked Questions
What test setup replicates datasheet power metrics?
Use a minimal, well‑matched board with the final antenna, a low‑noise supply, and firmware that isolates the state under test. Measure with a calibrated high‑sensitivity ammeter or shunt+differential ADC, run many cycles to average transient noise, and document temperature, supply voltage, and enabled retention blocks.
How should I pick TX power vs. reporting interval for battery life?
Start by increasing the reporting interval — it reduces total wake events linearly. Only lower TX power after verifying link budget with the final antenna and environment. If range requires higher power, increase interval or add edge processing to reduce uplink frequency instead of always using higher transmit power.
Which peripheral behaviors commonly hide excess current draw?
GPIO pull states, enabled unused peripherals, regulator quiescent current, and external sensor leakage are common culprits. Disable unused blocks, set known GPIO states on sleep, and measure with peripherals explicitly turned off to isolate SoC versus board contributions to total power.








