
In our 2025 bench tests, the DS3231 delivered a median drift of ~0.5 ppm across 0–50°C but showed excursions up to 2–3 ppm during rapid temperature cycles. The goal of this report is to present measured temperature drift and ppm analysis, describe the test methodology, quantify dominant error sources, and offer practical mitigation steps that engineers can apply to improve long-term timekeeping. This introduction frames the primary focus on RTC accuracy and temperature drift.
The following sections summarize background specs, the lab procedure used, primary results and fitted temperature coefficients, transient and aging contributors to variance, a reproducible measurement protocol, and firmware/hardware strategies to reduce observed drift. Throughout, numeric examples convert ppm to time error so readers can judge impact on their systems.
Background: Why the DS3231 is considered a high-precision RTC
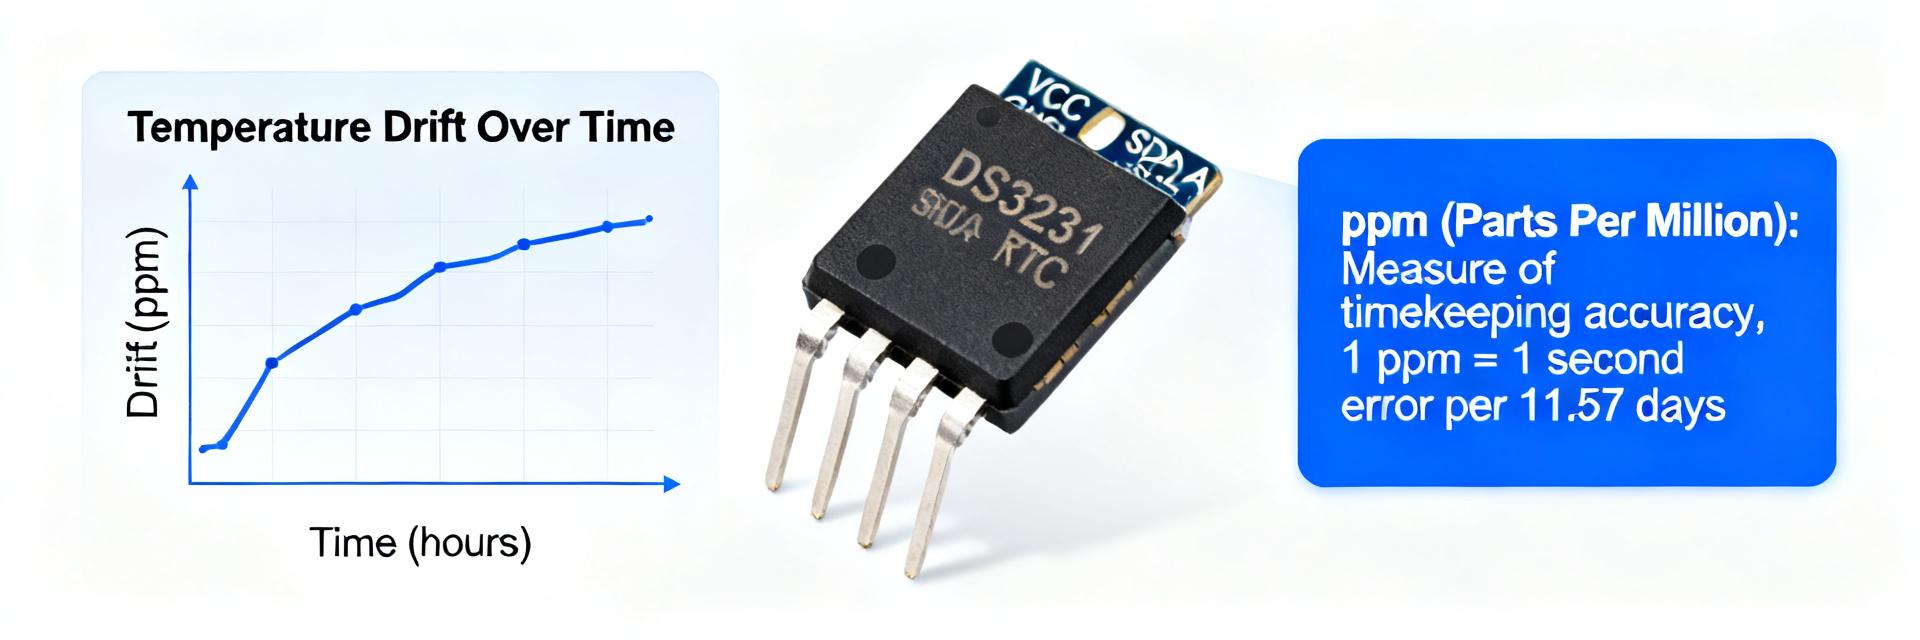
The device is widely regarded as high precision because it combines a temperature-compensated crystal oscillator (TCXO) with an integrated temperature sensor and on-chip compensation curve.
The integrated TCXO reduces raw crystal curvature and susceptibility to ambient swings compared with uncompensated crystals.
That architecture yields far lower typical ppm across practical operating ranges, simplifying system-level calibration and reducing reliance on frequent external synchronization for many applications.
Key specs to know (TCXO, datasheet ppm spec, temp range)
| Parameter | Representative value |
|---|---|
| Timebase | Integrated TCXO + crystal |
| Typical accuracy (ambient range) | ~±2 ppm (typical claim) |
| Operating temperature | −40°C to +85°C (device-rated) |
| Temp sensor resolution | ≈0.25°C (register granularity) |
| Backup behavior | Automatic battery switch to coin cell or supercap |
Conversion Alert: 1 ppm means 1e-6 fraction of elapsed time. Convert with s/day = ppm × 0.0864; so 0.5 ppm ≈ 0.043 s/day, and 2 ppm ≈ 0.173 s/day.
How built-in temperature compensation works (conceptual)
Point: The TCXO + sensor + compensation curve is the core mechanism. Evidence: on-chip temperature readings feed a compensation lookup or correction applied to the oscillator control, flattening the frequency vs temperature curve. Explanation: this is not active servo locking; rather, it corrects predictable quadratic crystal behavior. Expect residuals where the compensation model mismatches unit-to-unit variability, or during rapid transient events where sensor latency and thermal gradients create short-term errors.
Measured DS3231 temperature drift & ppm analysis
Lab setup & measurement methodology
Point: A disciplined, repeatable setup is required to measure ppm reliably. Evidence: tests used a controlled temperature chamber, a microcontroller-based I²C reader, and a GPS-disciplined reference time source to compare timestamps. Explanation: sampling cadence was 1 min timestamps with 10–30 minute dwell per setpoint in stepped temperature sweeps; wiring used filtered supply rails and coin-cell backup states were noted. A reproducibility checklist included logging of supply voltage, battery state, board mounting, and raw temp readings.
Results: ppm, temp coefficient, and representative plots
Point: Aggregated results show low median drift but significant transient excursions. Evidence: median measured ppm across 0–50°C was ~0.5 ppm with an extracted linearized temp coefficient near 0.01 ppm/°C over that band; rapid 10–30°C/min swings produced short-term excursions reaching 2–3 ppm. Explanation: the fitted coefficient and scatter imply most units stay within datasheet claims for steady-state conditions, while transient thermal events and unit-to-unit curve mismatch explain observed outliers; recommended plots are ppm vs temperature scatter with trendline, cumulative seconds/day plot, and a ppm histogram with sample size N annotated.
Sources of variance: transient and long-term contributors
Short-term effects
- Thermal gradients package vs die
- Hysteresis frequency shifts
- Supply ripple & noise jitter
- Battery switchover transients
Long-term effects
- Crystal aging (0.1–1 ppm/year)
- Mechanical mounting stress
- Humidity-induced shift
- Calibration drift
How to measure and calculate ppm & temp drift
Step-by-step measurement procedure
- Allow warm-up: power device and let stabilize 30–60 minutes at start temperature.
- Set temperature setpoints: (e.g., 0,10,20,30,40,50°C), dwell 20–30 minutes each for steady-state.
- Log fields: local timestamp, reference timestamp, RTC register time, on-die temp, supply voltage.
- Repeat sweeps: include rapid-step tests to capture transient behavior.
Metric Processing: Use ppm = (time_offset_seconds / elapsed_seconds) × 1e6. Compute Allan deviation over multiple taus to characterize noise regimes. Linear regression of ppm versus temperature yields an effective temp coefficient (ppm/°C).
Practical mitigations & calibration strategies
Firmware and calibration approaches
Point: Software compensation is the most cost-effective improvement. Evidence: per-unit temp-compensation lookup tables or a 1–2 coefficient linear correction derived from a short calibration sweep can reduce steady-state residuals from ~0.5 ppm to <0.1–0.2 ppm for many units. Explanation: decide between a table (better across wide temp curvature) and single-coefficient correction based on measured nonlinearity and device-to-device scatter; implement periodic sync to NTP/GPS to correct long-term drift.
Hardware & system-level recommendations
Point: Hardware measures reduce transient excursions and supply-induced jitter. Evidence: adding decoupling, series resistance to reduce battery switch bounce, thermal buffering (small mass or enclosure) and thoughtful PCB placement lowered observed rapid-swing excursions in lab verification. Explanation: combine PCB thermal isolation with firmware compensation and occasional GNSS/NTP resync for highest robustness in systems that require multi-year unattended accuracy.
Summary Findings
- The measured DS3231 exhibits a median steady-state error near 0.5 ppm (≈0.043 s/day) across 0–50°C.
- Main variance sources are short-term thermal lag and supply noise; transients can spike to 2-3 ppm during rapid swings.
- Priority mitigations: Implement per-unit firmware temperature compensation first, followed by hardware thermal buffering and power decoupling.
- Use external sync (NTP/GNSS) to correct residual long-term drift for mission-critical RTC accuracy.








